


Nobody is Prepared for What Comes Next : Part 2 - Wednesday 13 December 2023

Roy Wenzlick
During the depths of the Great Depression, one of the lone voices calling for a boom was Roy Wenzlick, PhD (Econ, St Louis). The forecast was laid out in the book, “The Coming Boom in Real Estate and What to DO About It” in 1936. That book made it onto The New York Times best-seller list, alongside titles such as Gone with the Wind.
Wenzlick was a real estate guy (the family business into which he was born), and he compiled and analyzed vast amounts of data. Nationwide real estate prices, Interest rates, stock prices, commodities, demographics, and much more.
Take a look at this for example: The Real Estate Analyst - December 1936.

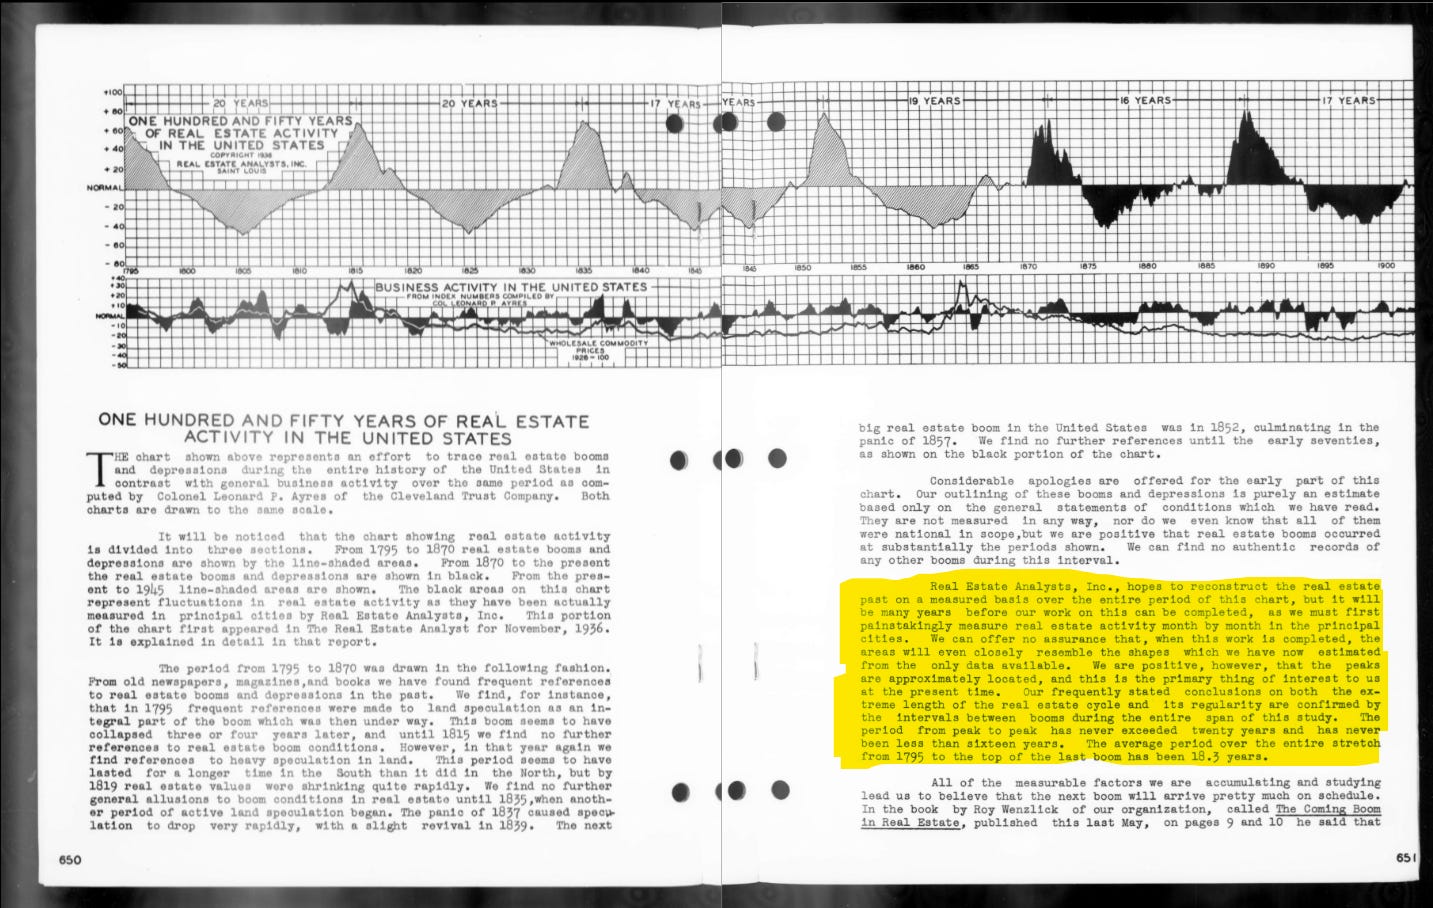
He published this journal from 1932 until 1973 when he retired. In the link above, focus on page 650/51 - “ONE HUNDRED AND FIFTY YEARS OF REAL ESTATE ACTIVITY IN THE UNITED STATES” - where he describes and charts an 18.3-year Real Estate Cycle (REC henceforth - previously I have used terms such as Land Cycle or THE Boom and Bust Cycle or the Property Cycle…get the idea?)
In later years he would write:
“Thirty-eight years ago, I pointed out in the Real Estate Analyst (1936) that real estate had followed a long cycle which I later determined to average 18 1/3 years. When charted from 1795 to the date of publication it was rather remarkable that the booms and depressions in real estate as measured by the relationship of the number of families had followed a rather consistent pattern of booms and depressions.
I never indicated that in each real estate cycle the booms and depressions that followed would equal exactly 18 1/3 years. Some were slightly longer, and some were shorter. But the average length from the peak of one boom to the peak of another, and from the bottom of one depression to the bottom of the next, averaged out at 18 1/3 years.”
If you have been paying attention, you saw a modern treatment of the REC in two recent articles. First, using spectral analysis of the 400-year-old Amsterdam House Price Index, and second, using a Neural Network technology on the US Case-Shiller Home Price Index.
Sunday 19 November 2023: What 400 Years of Amsterdam House Price Data Reveal About the 2020s

The Herengracht Index is the oldest house price index in the world. The Herengracht Canal in Amsterdam holds significant prestige, serving as a coveted address for the city's affluent residents, including the mayor, bankers, lawyers, and celebrities. Originating from the 17th century, this canal was once home to the wealthiest merchants during Amsterdam's golden era as a global financial hub. Transaction prices of real estate on the Herengracht have been carefully recorded since 1628.
Sunday 26 November 2023: AI Predicts Timing of next House Price Crash

Case-Shiller Real Home Price This week, we are going to use a Neural Network to forecast the S&P CoreLogic Case-Shiller U.S. National Real Home Price NSA Index. It is a composite of single-family home price indices for the nine U.S. Census divisions and is calculated monthly. It is included in the S&P CoreLogic Case-Shiller Home Price Index Series which seeks to measure changes in the total value of all existing single-family housing stock.
Perhaps it is easy to see why Wenzlick had this to say:
“Few men under fifty today have been in business long enough to have experienced more than one general real estate boom. Unless a man has been in business for seventeen years, he did not experience the beginning of the last real estate boom.
The length of the real estate cycle, therefore, makes it necessary to supplement the relatively short experience of the individual with an historical knowledge of the causes and effects in previous cycles, with the danger signs, with the sequence of events in the depressions and recoveries, and with such other material as will aid in making his real estate investments with the least risk and the maximum profit.
In order to acquire such knowledge, we have compiled figures month by month on all factors affecting real estate from the Civil War to the present. These studies started in St. Louis. They have now been ex tended to cover all of the principal cities in the United States.
The advices…are not armchair philosophies drawn from the cogitations of a superintelligence turned in upon itself. They are the common sense interpretations of hundreds of charts and studies showing real estate fluctuations and their causes in these periods in the past. We believe that any one with average intelligence would have reached the same conclusions from the same studies.”
Another intellectual giant of that era, Edward R. Dewey (founder of The Foundation for the Study of Cycles), said:
Dewey has this to say:
“The welfare of an individual is often determined by the time in which he was born. If he is old enough to start business at the low of a building cycle, which is accompanied by a falling value of gold and rising prices, his chances for success are very good. Conversely, if he is born at such a date that he starts in business at the peak of a building cycle, which is accompanied by falling commodity prices, his chances of success are small. Much of the success or failure of an individual is due to forces over which he has no control; but if he understands these forces, he may protect himself from the worst results of unfavourable combinations and profit personally from favourable combinations.”
If I have not made it clear before, let me state it in plain terms. The REC is THE MOST IMPORTANT cycle for you to study and understand. It goes to the core of how we (mankind) have chosen to structure our societies. We have created a paradise for rent-seeking and almost every conceivable economic and social ill flows from this. For you, the investor, the more immediate concern is probably the fact that roughly every generation (18.6 years or so on average), a speculative frenzy reaches its limit and a real estate bust occurs. The bust crashes the stock market, implodes the banking system, bankrupts businesses, jacks up unemployment and that is just a start. However, every generation keeps asking the question, “Why did nobody see it coming?”, as Queen Elizabeth asked in November 2008:
Sunday 12 November 2023: Boom and Bust

The Corruption of Economics You must understand that mainstream Economics is UTTERLY and COMPLETELY WRONG. That is because the discipline has been deliberately and systematically corrupted since the early 1900s. We need to re-educate ourselves with the most basic knowledge of the Classical Economists of old. Once you have this knowledge, it is easy to see why Economics HAD TO be corrupted (more on this in subsequent posts):
Today’s exercise will demonstrate why investors/traders MUST track the REC intimately (if you are not convinced to do so yet).
Step 1
Download DJI price history from 1789 until 1990. This will be the training data to which we will fit a model using the REC. We will use the model to forecast the DJI until the present day and make comparisons.

I will also include the semi-log chart here:

Step 2
Run the TS Sprectrum module which reveals a strong periodicity of 18.86 years i.e. The REC (there is also a strong peak at half that period i.e. The Juglar Cycle). Project a committee of the REC into the future i.e. a sinusoidal wave with an 18.86-year periodicity with varying inputs (stock-memory and overtones.
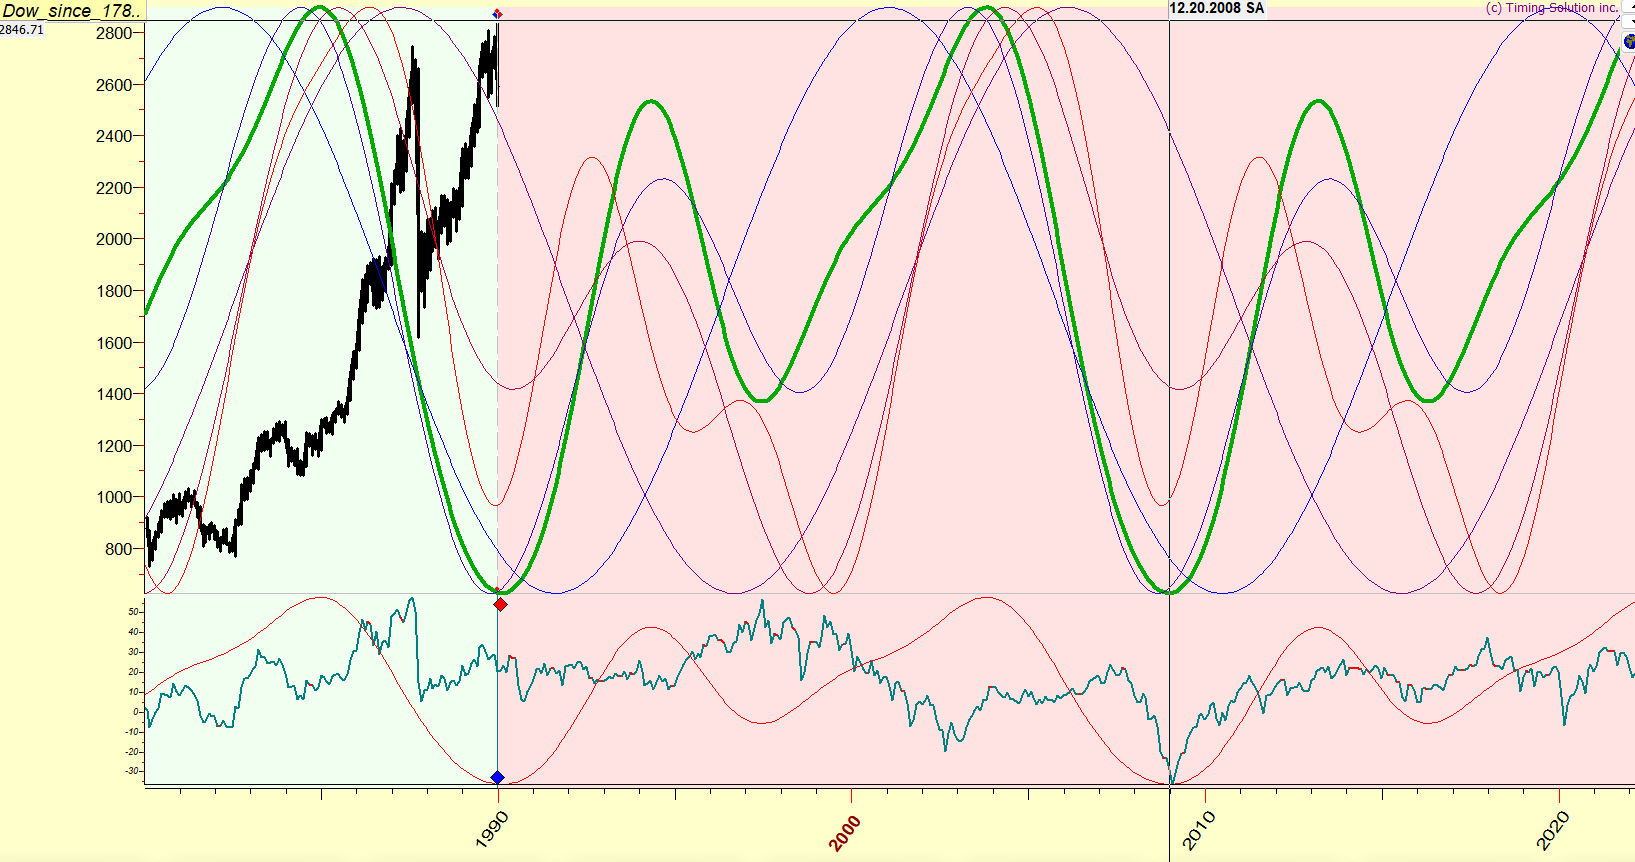
The bold green projection uses all available price history until 1990 and four overtones. Notice how the committee of projections forecasts a confluence of major cycle beats (lows) in 2008/2009 i.e. roughly 18 years from the Savings and Loans Crisis of 1991 which marked the end of the previous REC which saw major booms in Japan, the UK, and the US.
Step 3
Take lagged versions of the DJI price history with lag parameters that are multiples of 18.86 years. Given the length of the cycle, we can use all available lags.
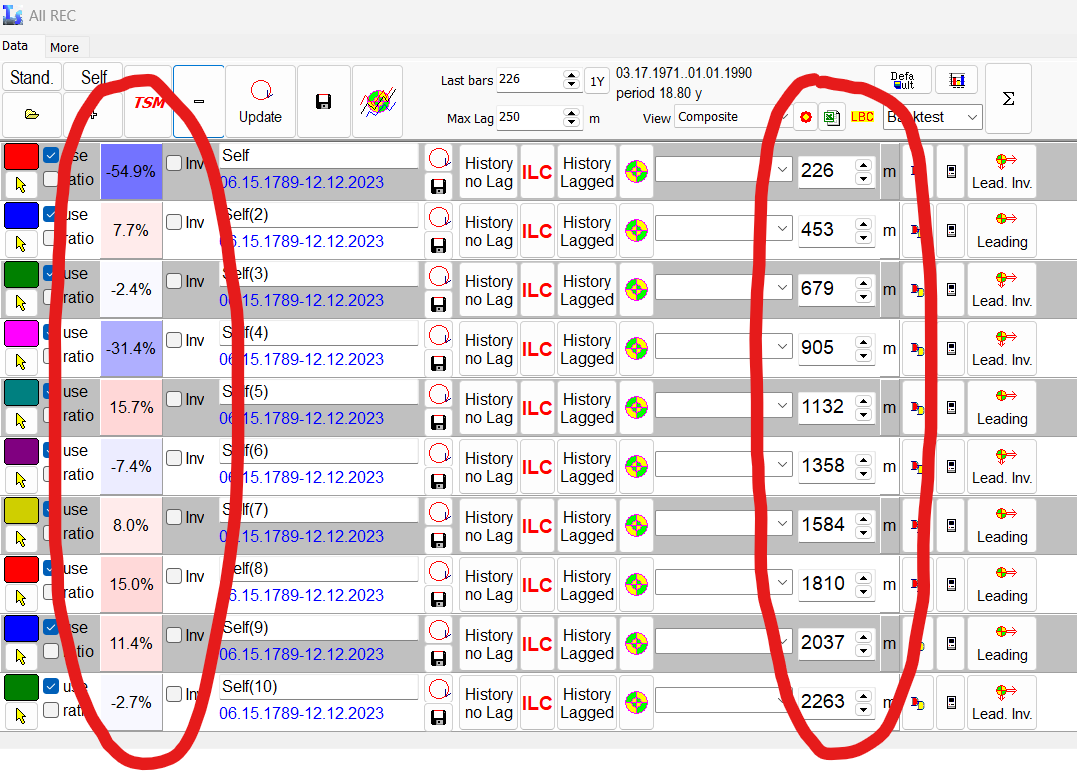
You can see that some of the lags are negatively correlated with the most recent iteration of the cycle in the test data, while others are positively correlated. For the projections below, the purple forecast uses all the lags while the blue uses those that had a positive correlation with the last instance of the REC.

Again, notice the major cycle beat projected for 2009 in the composites of lagged charts
Step 4
Plot the projection from the above composite lag chart and the realized DJI side by side.

Once again, the cycle-based lagged charts are a great tool to identify out-of-sample cycle beats.
Post-fight recap
What is a lagged chart?
Below is the DJI plotted together with a 60-month lag:

So suppose that I was convinced that the current environment is exactly like the 1970s, and that inflation is going to make a comeback. I could plot a 634-month lag as a forecast…

…and show how well correlated it is with the present…

I believe they call these “Historical Analogs”.
So, in essence, I have created composite indices from cycle-based in-sample historical analogs to forecast out-of-sample time series. Make sense?
So back to the main chart in Step 4. Do you understand this cycle/rhythm/fluctuation?
The WFA report is thus:

What Roy Wenzlick discovered in the 1930s (and others discovered/confirmed at various times) is a very stable rhythm in land prices. This rhythm affects the entire economy in profound ways and can be detected in various economic time series data.
Forecast: The Roaring 20s and The Great Depression 2.0
You are now in possession of two vital economic “clocks”. Subscribe and stay tuned for the video in which we will decipher these and other important “clocks” to forecast the pivotal years to come.