


The 2025 Roadmap — Part 5: The Housing Market Is Forecasting When The Economy Will Crash — Sunday 12 January 2025

A Deep Dive into HOPE and Markets
The HOPE framework is a concept rooted in understanding how economic changes ripple through markets. It's an acronym describing the sequence in which various economic indicators react to rate changes: Housing, Orders, Profits, and Employment. Originally suggested by Michael Kantrowitz, this roadmap provides insights into these factors' interconnectedness.

However, my take on the HOPE framework extends beyond the surface, diving into how the land cycle dictates market movements—particularly the critical relationship between home prices, homebuilder stocks, and the broader market.

Video password in the footer.
Section 1: The HOPE Framework Reimagined
When Michael Kantrowitz introduced the HOPE framework, it was hailed as a robust way to understand economic reactions. My analysis took this one step further, demonstrating that home prices often lead interest rates, contrary to the framework's linear assumption. The leading indicators are homebuilder stocks, which act as a discounting mechanism, reflecting anticipated economic shifts.
Key Insight: Instead of focusing solely on rate changes, tracking homebuilder stocks reveals earlier trends. This insight birthed my model: The Anatomy of a Land Cycle Peak.
Section 2: The Land Cycle—A Booming and Busting Giant
The land cycle, with its inherent boom-and-bust patterns, forms the backbone of my analysis. It is the most significant long-term economic cycle, driven by policy and economic rent manipulation. By examining historical patterns, we see recurring peaks and troughs in homebuilder stocks that align with land cycle dynamics.
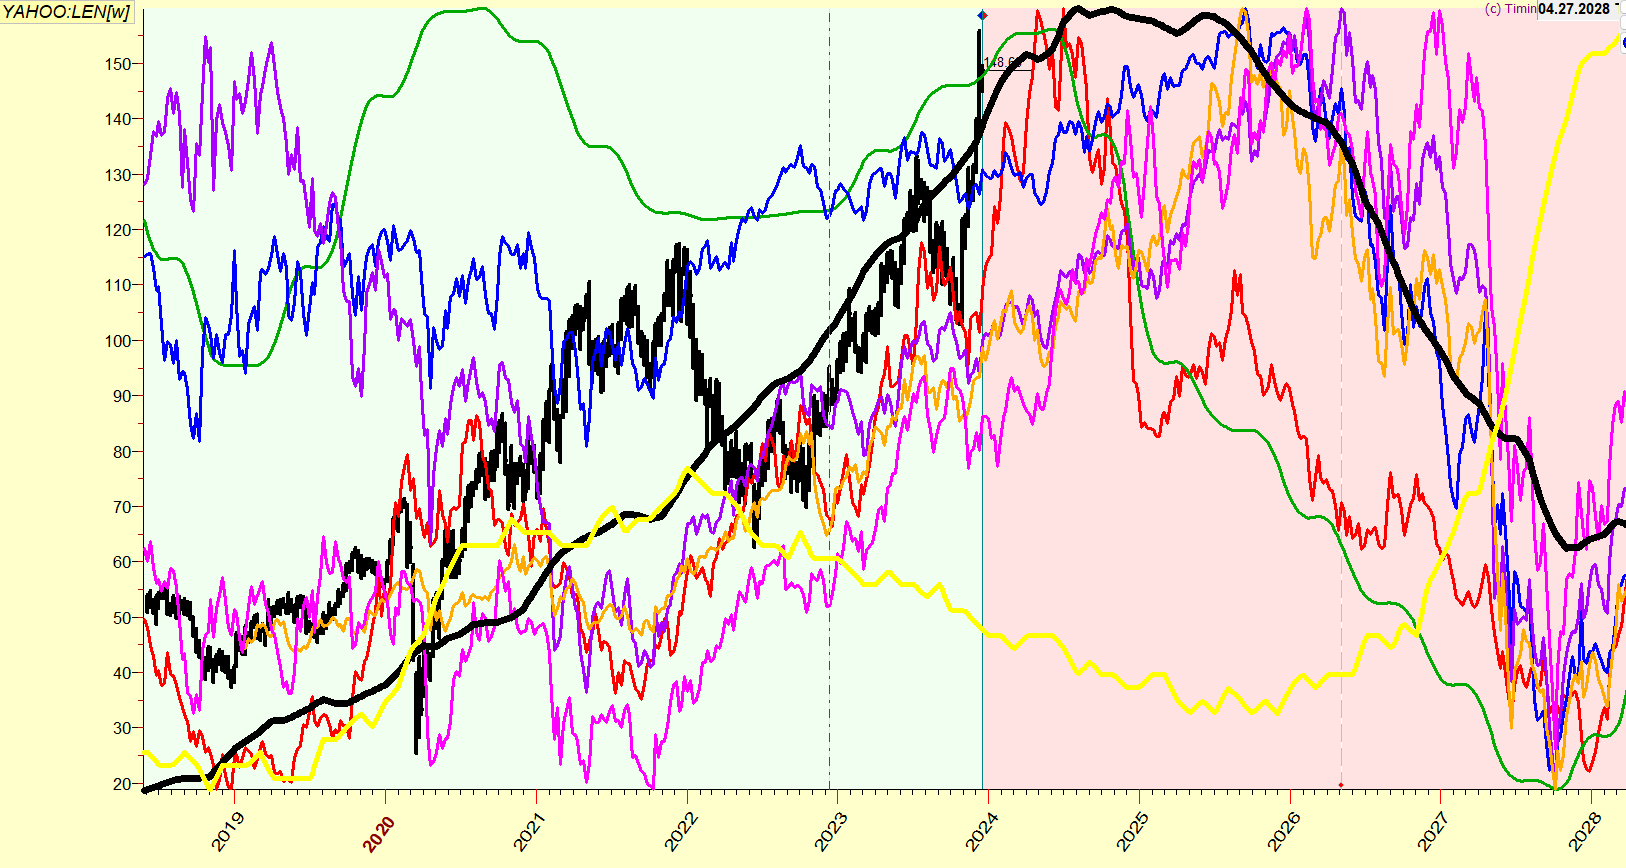
December 2023 Observations:
Homebuilder stocks like Lennar (LEN) were at all-time highs, signalling a continuation of the bull market.
This suggested a broader market peak might be two years away, underlining the resilience of the economic expansion in 2023.
Section 3: Tracking Divergences and Trends
By March 2024, I refined my forecast. Extending the timeline, I identified a window for a peak in homebuilder stocks between March 2024 and July 2025 based on the Land Cycle. This informed my bullish stance through 2024, as the market remained in a “buy-the-dip” regime.
May 2024 Adjustments: Divergences started to emerge:
The S&P 500 continued climbing while homebuilder stocks struggled.
I initiated small short positions on homebuilder-focused ETFs (e.g., ITB and XHB), anticipating future underperformance.

Section 4: Lessons from History—A Look Back to Predict Forward
Historical data reinforces the pattern:
Homebuilder stocks peak two to two-and-a-half years before the broad market.
By the time the S&P peaks, homebuilder stocks have typically fallen between 30%-66%.

Section 5: Where Are We Now?
Fast forward to late 2024, the divergence became more pronounced:
SPY (broad market) gained nearly 10%, while homebuilders dropped about 3%.
By October, the reversal I had forecast began materializing, signalling the potential start of a prolonged underperformance for homebuilder stocks.
Conclusion: The Value of the HOPE Framework in Market Strategy
When paired with a deeper understanding of the land cycle, the HOPE framework offers a powerful tool for market analysis. By identifying homebuilder stocks as the ultimate leading indicator, this approach helps decode market trends and prepare for turning points.
Takeaway: Whether you're an investor or a market enthusiast, tracking these cycles and their interplay is essential for navigating the peaks and troughs of economic activity.
Stay tuned for future updates as I continue to refine the roadmap and share insights into this evolving market landscape.