
Sunday 19 March 2023: Traders' Handbook of Economic Cycles - Chapter 6: Dow Calendar Statistics

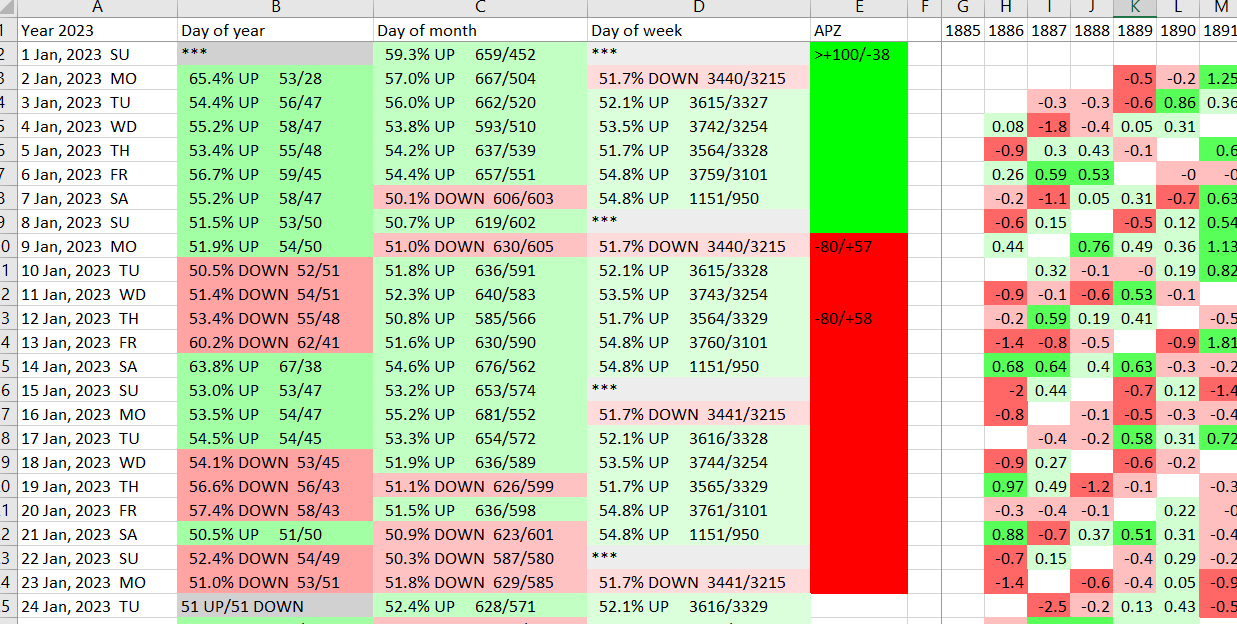
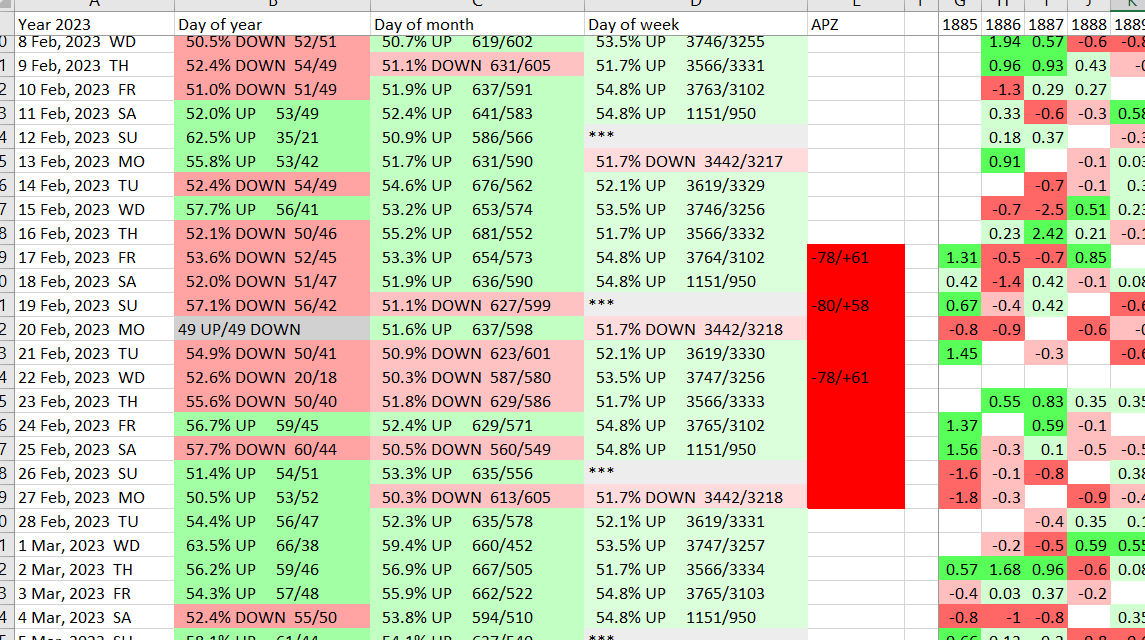
You should have received an Excel file a few days ago titled “DOW Calendar Statistics”. Most of the columns are self-explanatory. The column of interest is “APZ”. This denotes the Annual Predictable Zones subject to certain criteria.
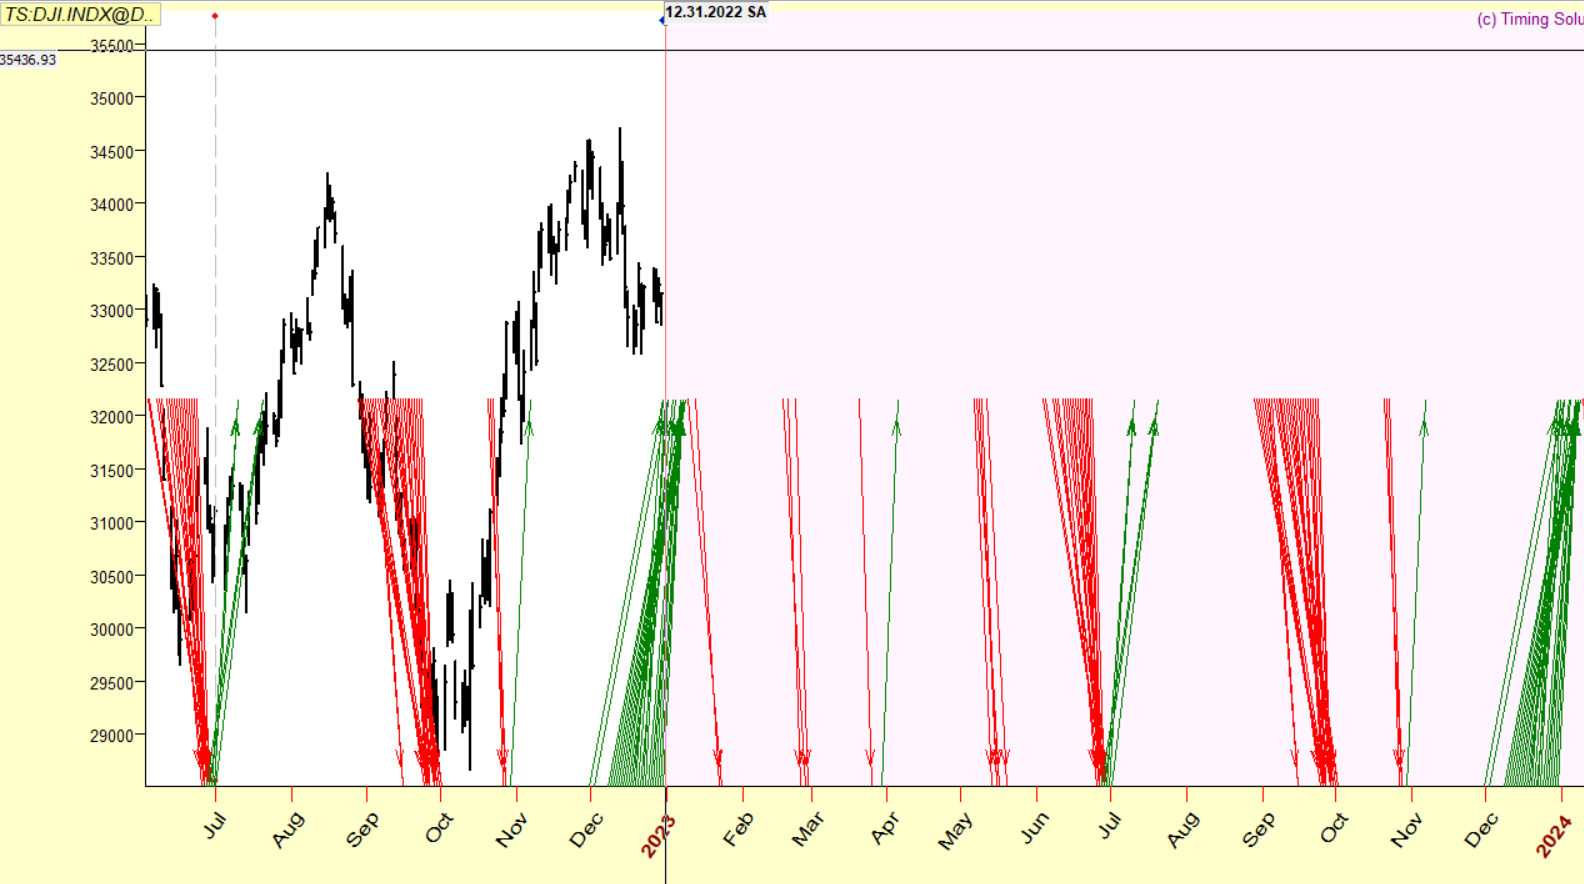
The first chart below illustrates those zones with arrows overlaid on the price history of the Dow up until the end of 2022. Notice how the APZs have so far identified many major swings in 2023.
Next we will overlay one of our primary cycles from the Heatmap.
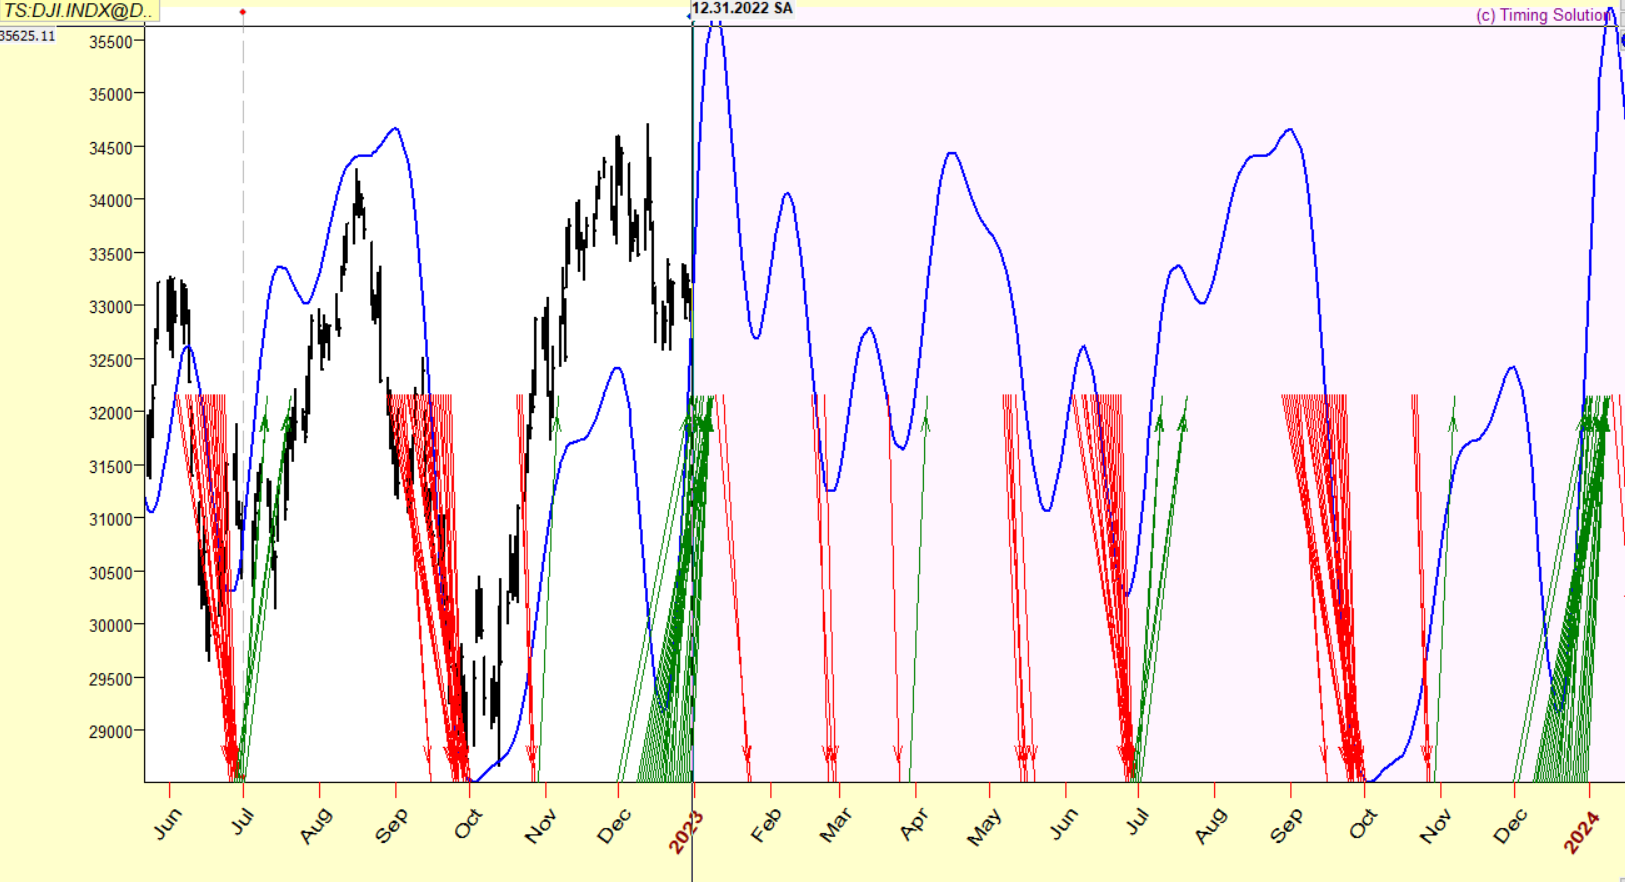
The BLUE line depicts the projection from said cycle, using all the daily price history of the Dow. The combination of the APZs and the projection line can help identify which swings to pay the most attention to.
Finally we will also add a projection line from the same cycle using only recent price history:
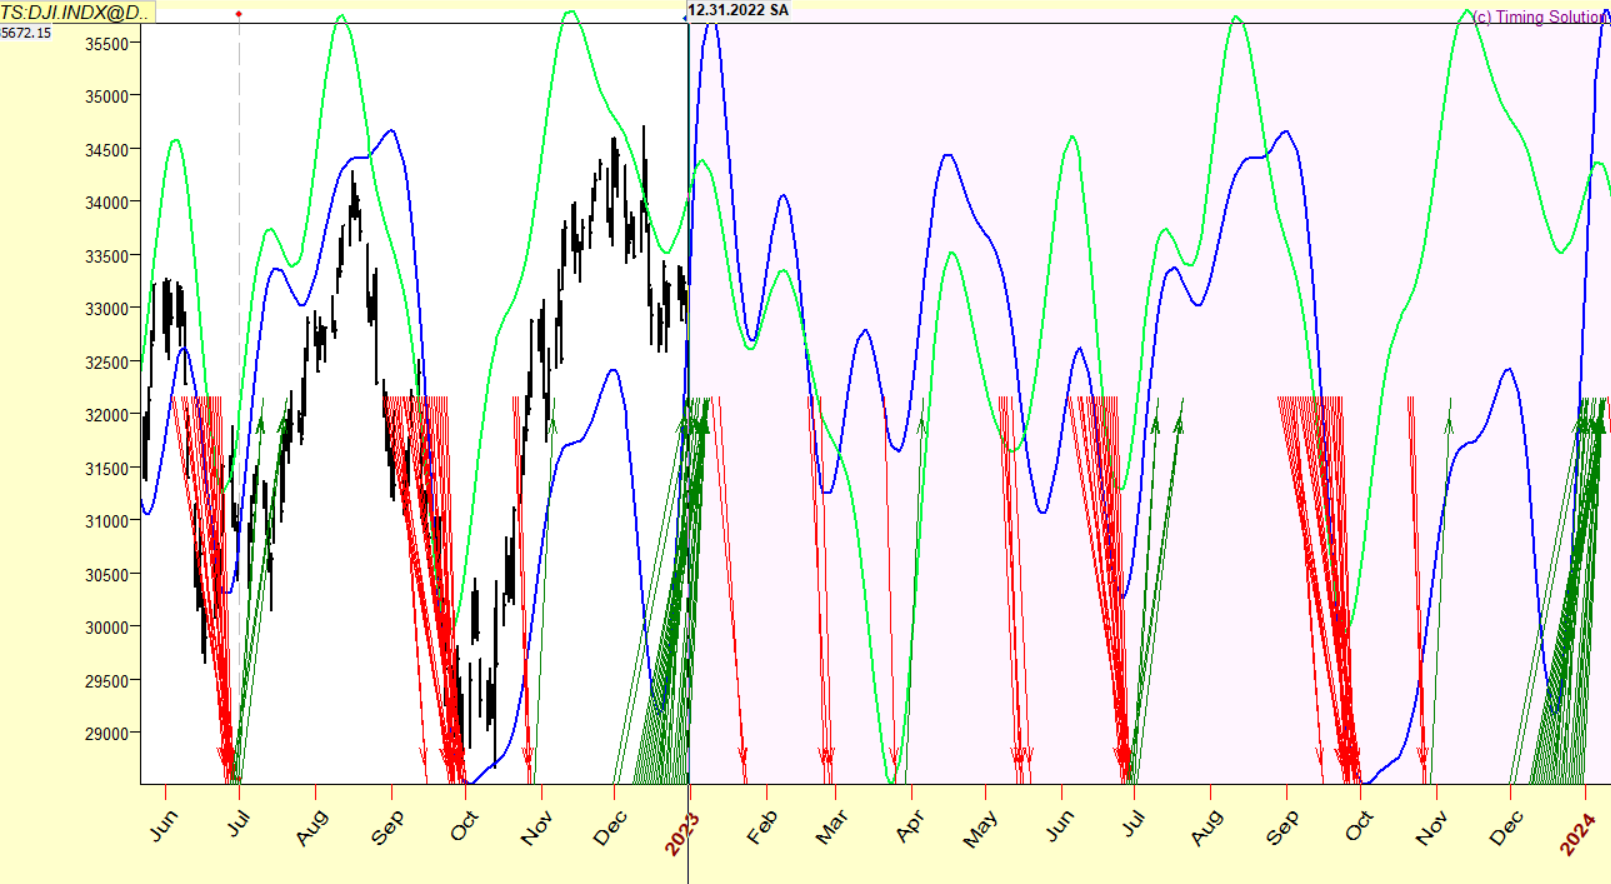
For the most part we see many similarities between the BLUE and GREEN projection lines. There are only minor differences in the timing of some beats.
Let us now add the price action seen in 2023 year-to-date:
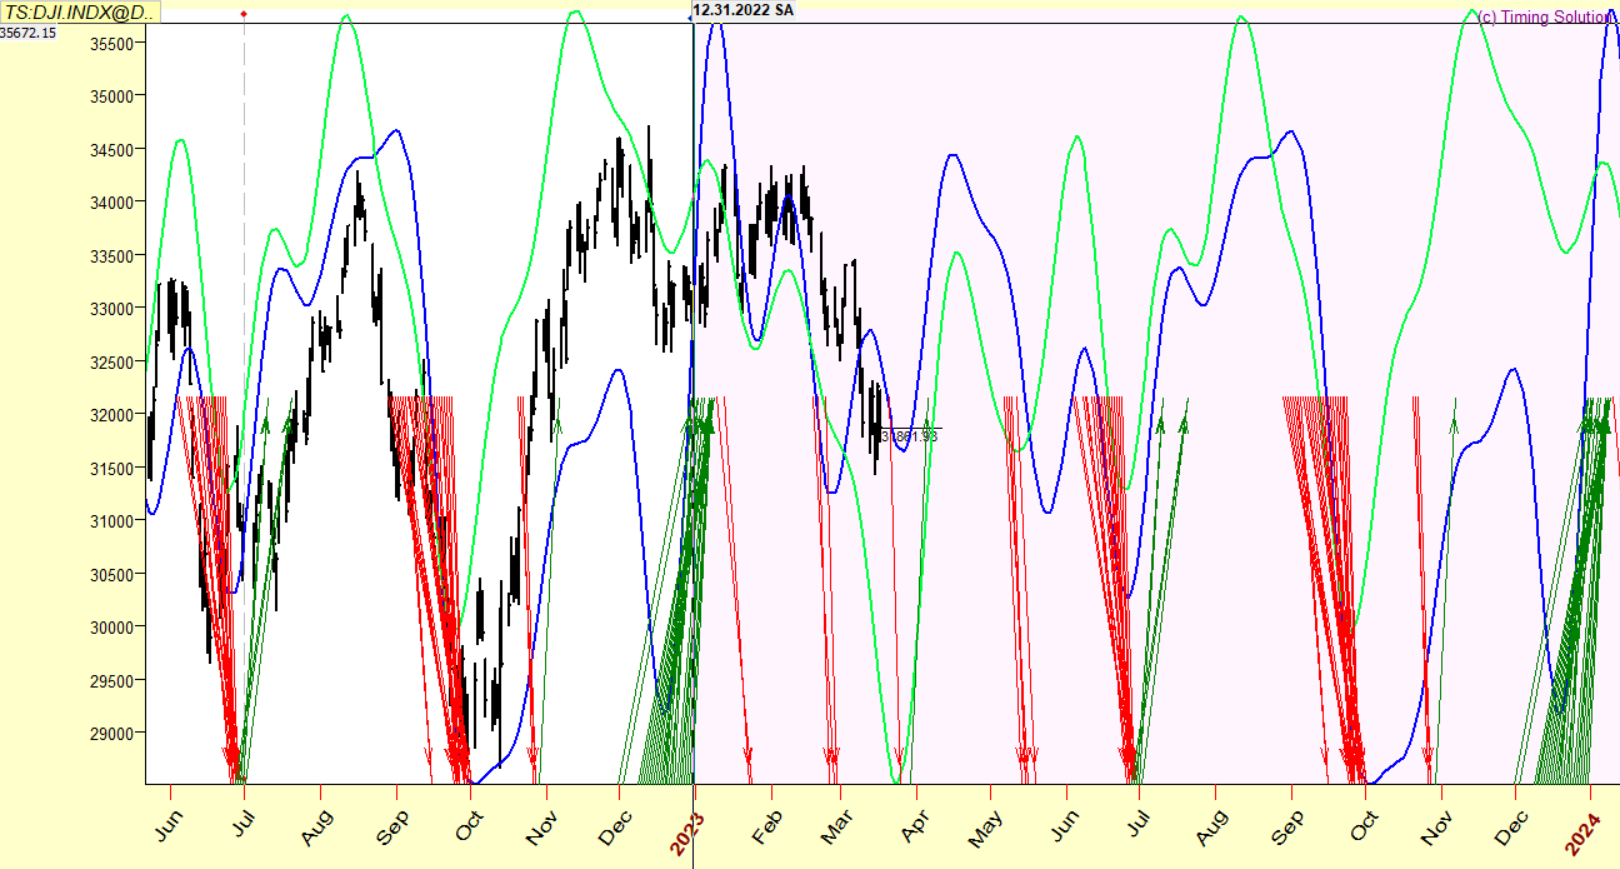
Perhaps you can see why I am on high-alert into the late-March/early-April period. You can also see it on your spreadsheet if you prefer that format. Another cycle beat of importance has a high likelihood of occurring in the next few weeks and so I will be watching important levels/signals like a hawk.
Levels:
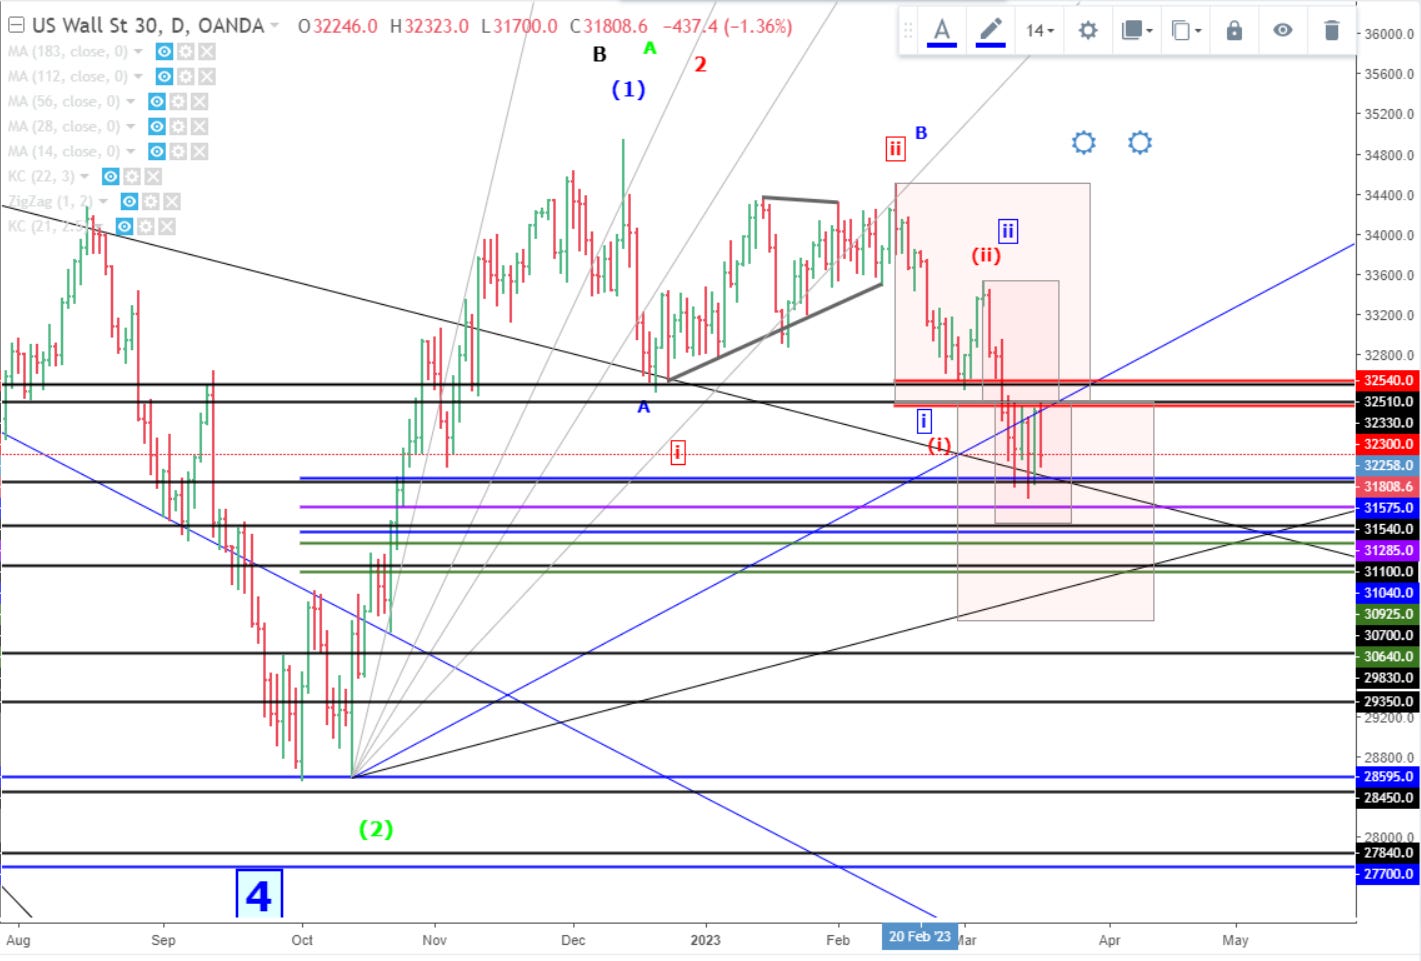
Nearby I am watching 31,100 and then 30,700.
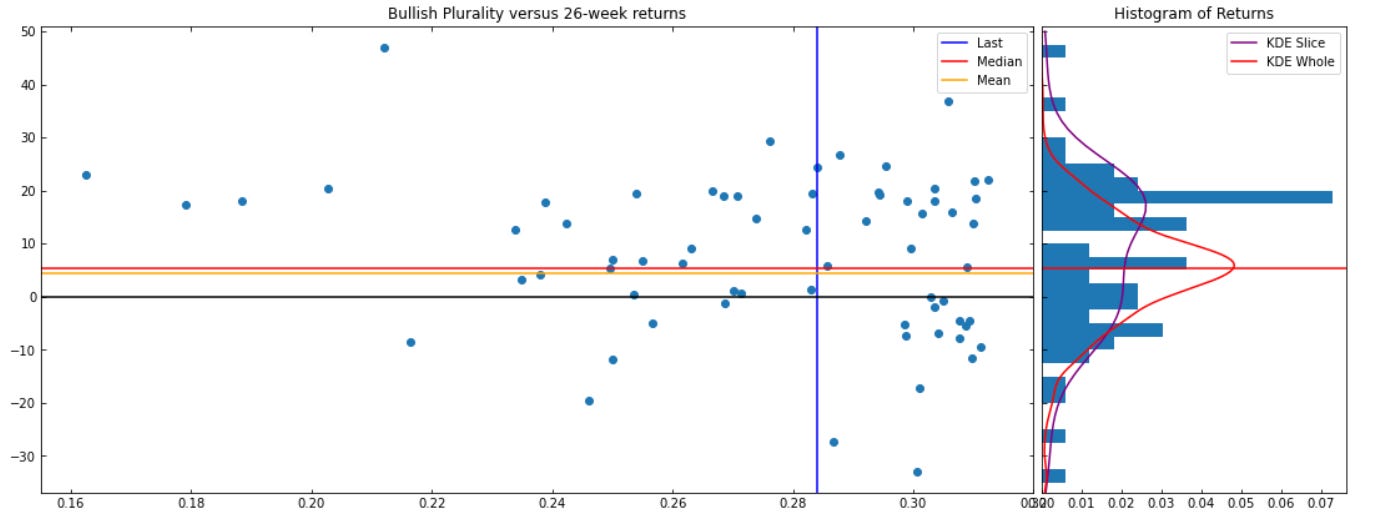
Unsurprisingly, sentiment is now extremely pessimistic…
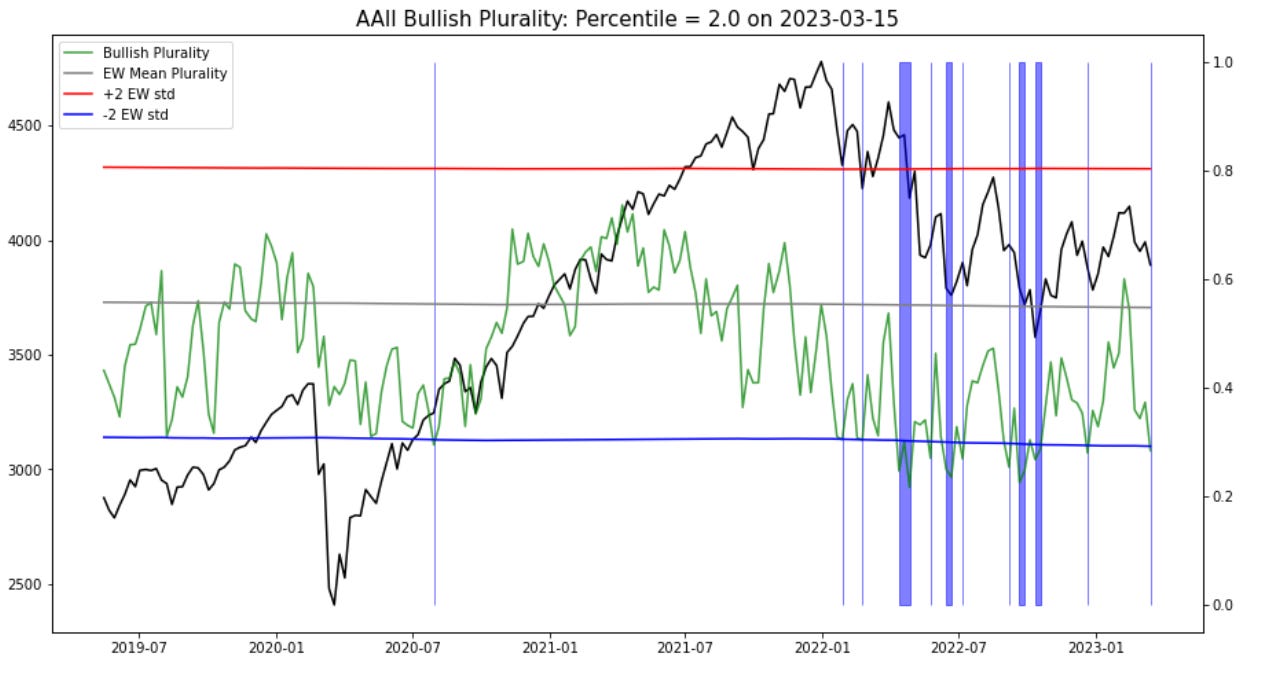
… and is now in the region of interest:
Finally, in the midst of all this, some of the industry titans are doing this:
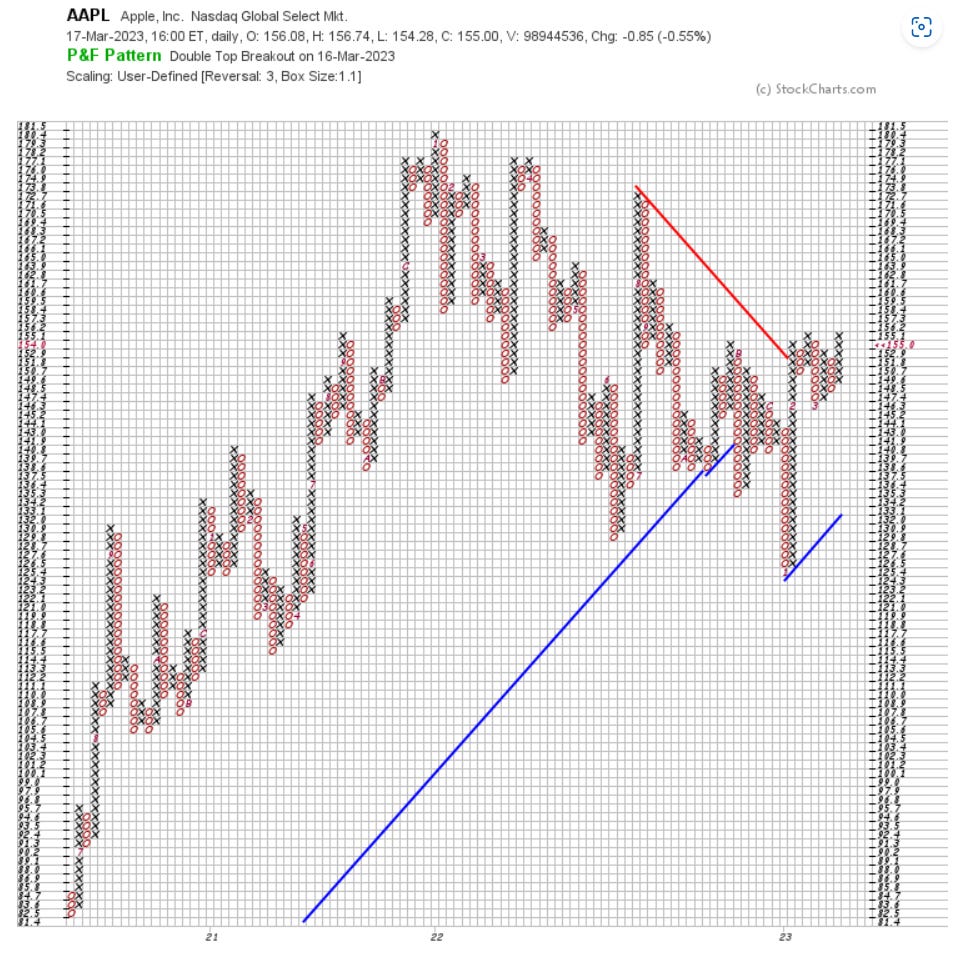
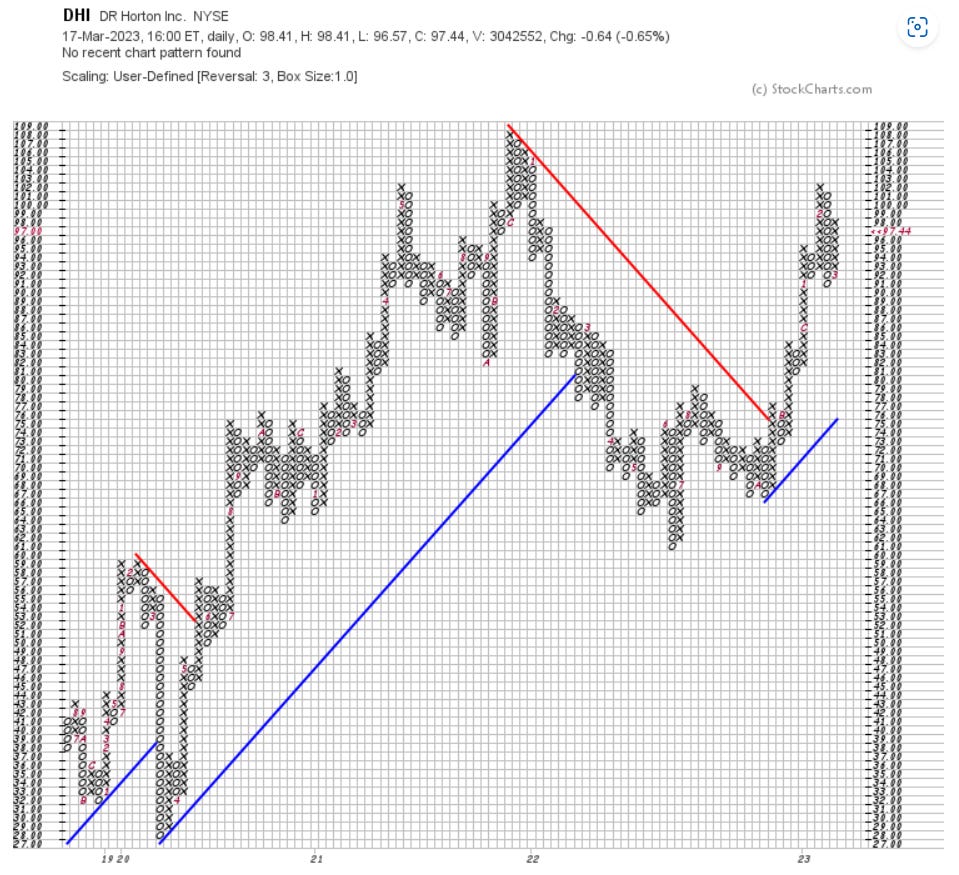
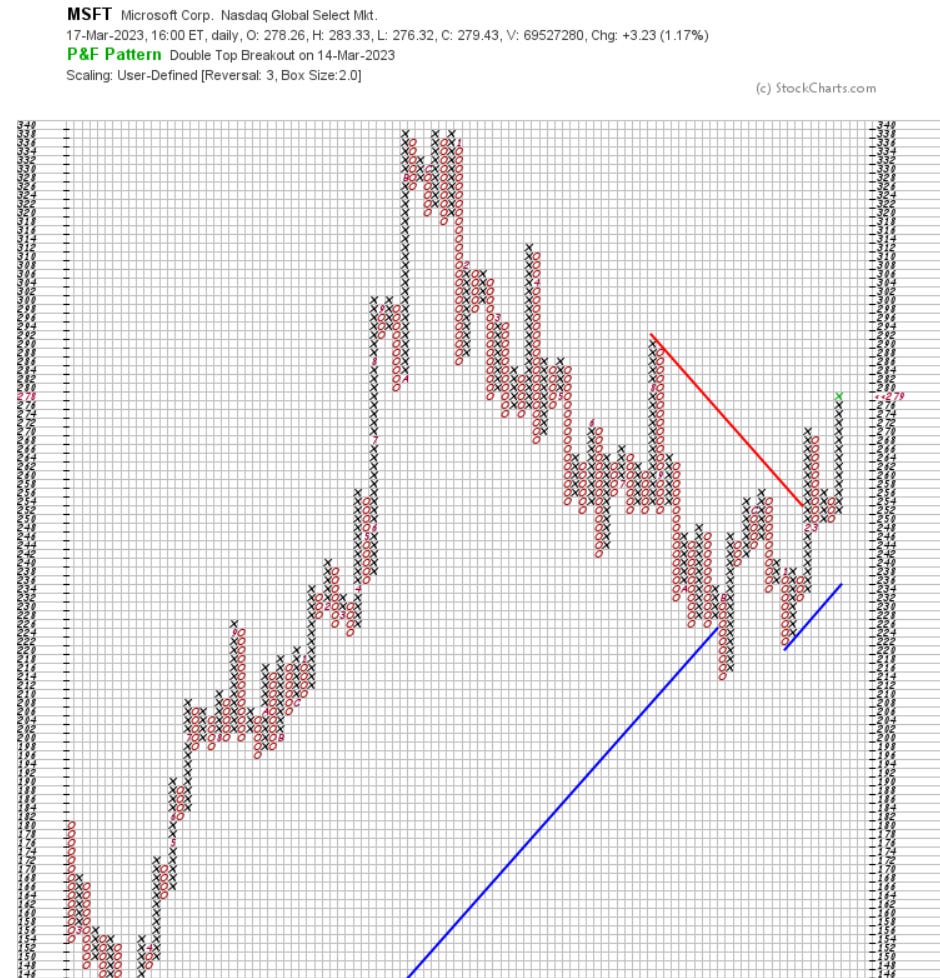
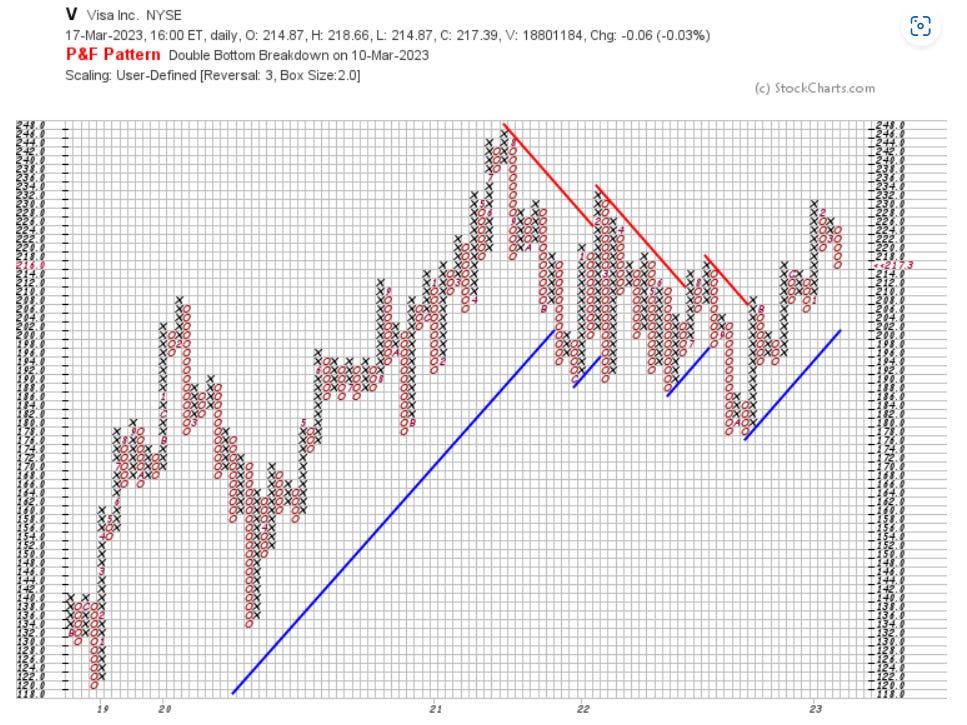
These are/will be names to be bought (with stops as always) for potential large run ups. They have broken the downtrend of 2022 and are/have been tracing breakout patterns, with some tech stocks in particular showing strength during this “banking crisis”.